

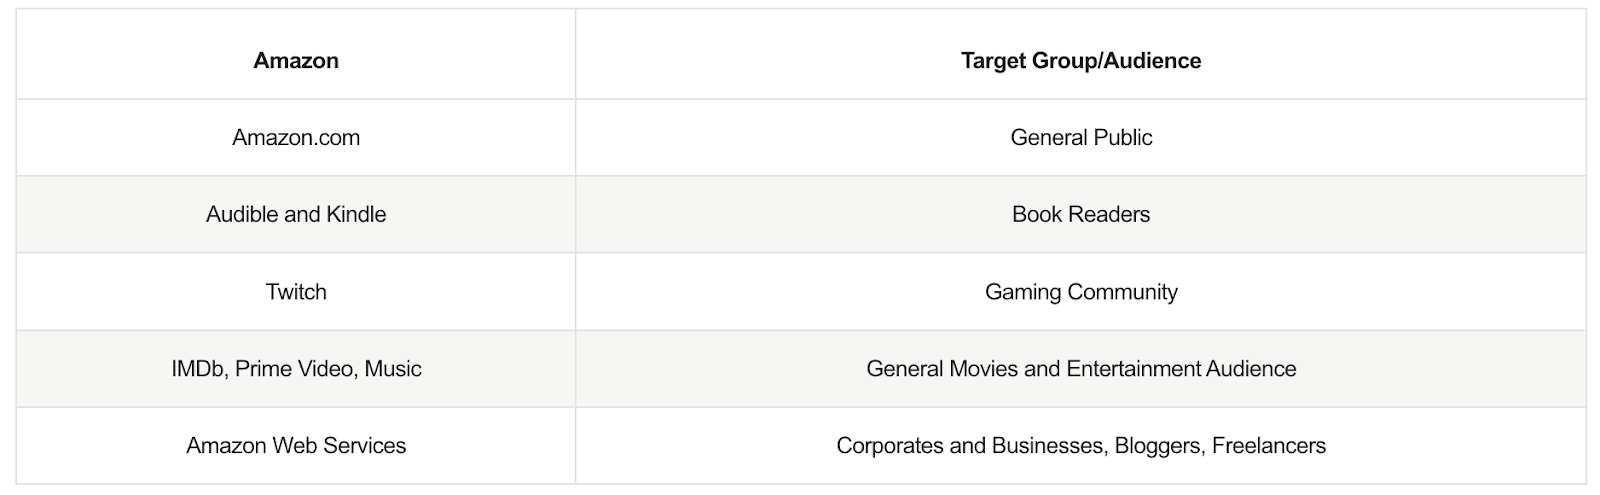
Amazon caters to a broad audience including individual consumers as well as businesses of all sizes.
Source: Google
.png)
Source: Google
Amazon entered the fashion segment in 2002. Over the years it has expanded significantly, offering a wide range from everyday wear to high-end designer items. Innovations like Prime Wardrobe and StyleSnap (AI-powered visual search) have helped it become a major player in online fashion.
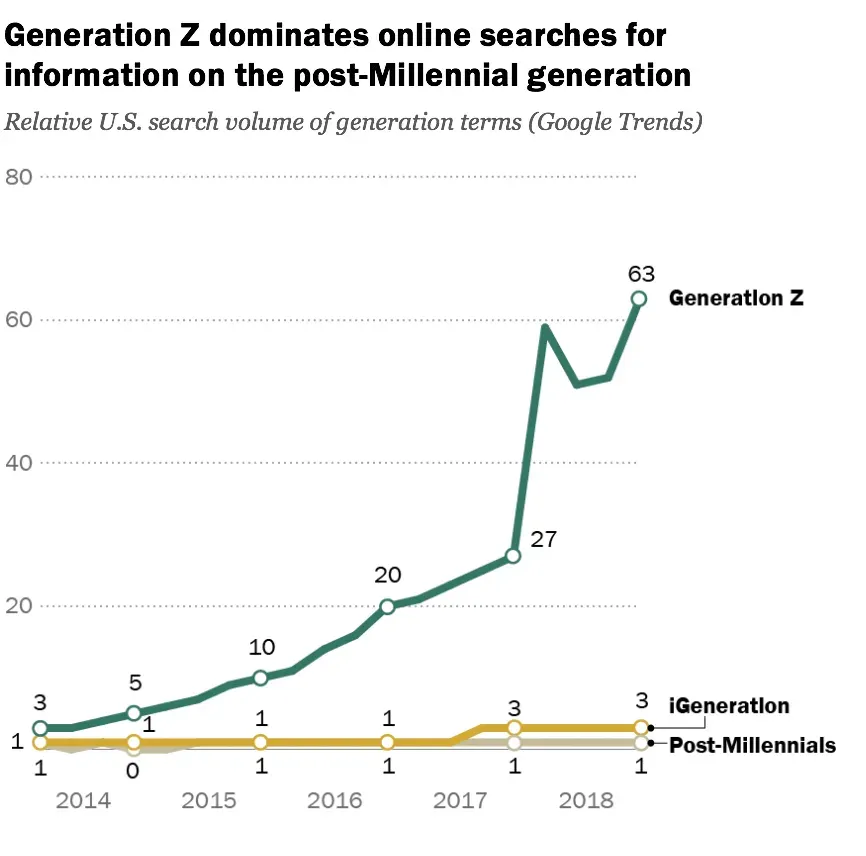
Some of the possible reasons why there is a drop in retention on Amazon Fashion:
.webp)
| Why Should We Improve? | Benefits |
|---|---|
|
• Repeat purchases affect profitability • Increases growth of customer base • More attractive pricing for customers |
• Increases Customer Lifetime Value (CLV) • Improve competitive advantage for Amazon retailers • Economies of scale for Amazon • Reduce Customer Acquisition Costs (CAC) |
Why should Amazon improve repeat purchases in fashion?
| Product Outcome | Business Outcome |
|---|---|
|
• Better personalized recommendations • Increased time spent / user browsing fashion • Community around fashion |
• Reduction in customer churn rate • Grow revenue • Grow profit • Grow margin • Grow market share |
The general segment is women aged 18–45 who are digital natives — young working professionals, fresh university graduates, and mid-level career women. The identified target segments are:
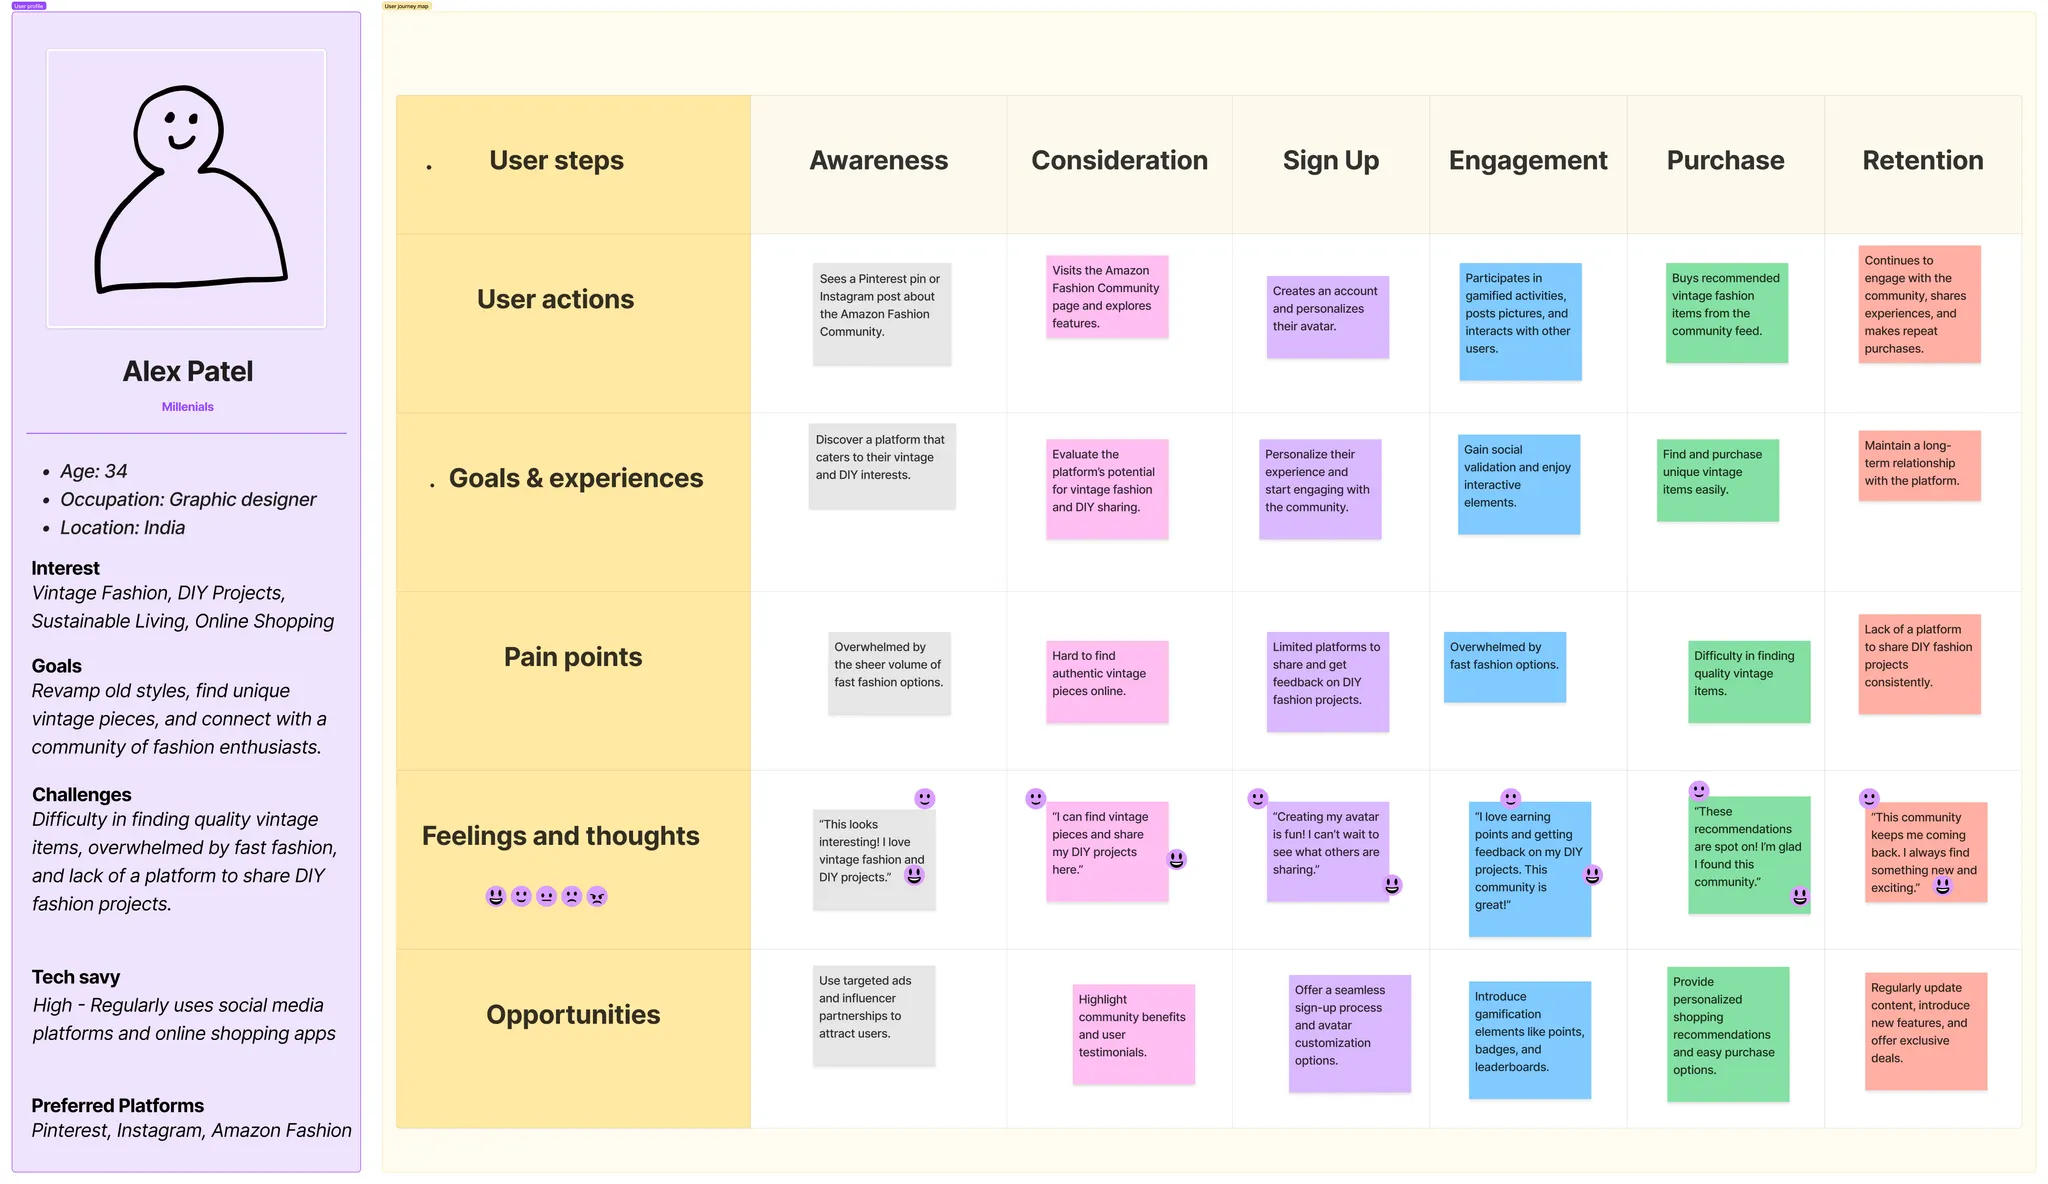
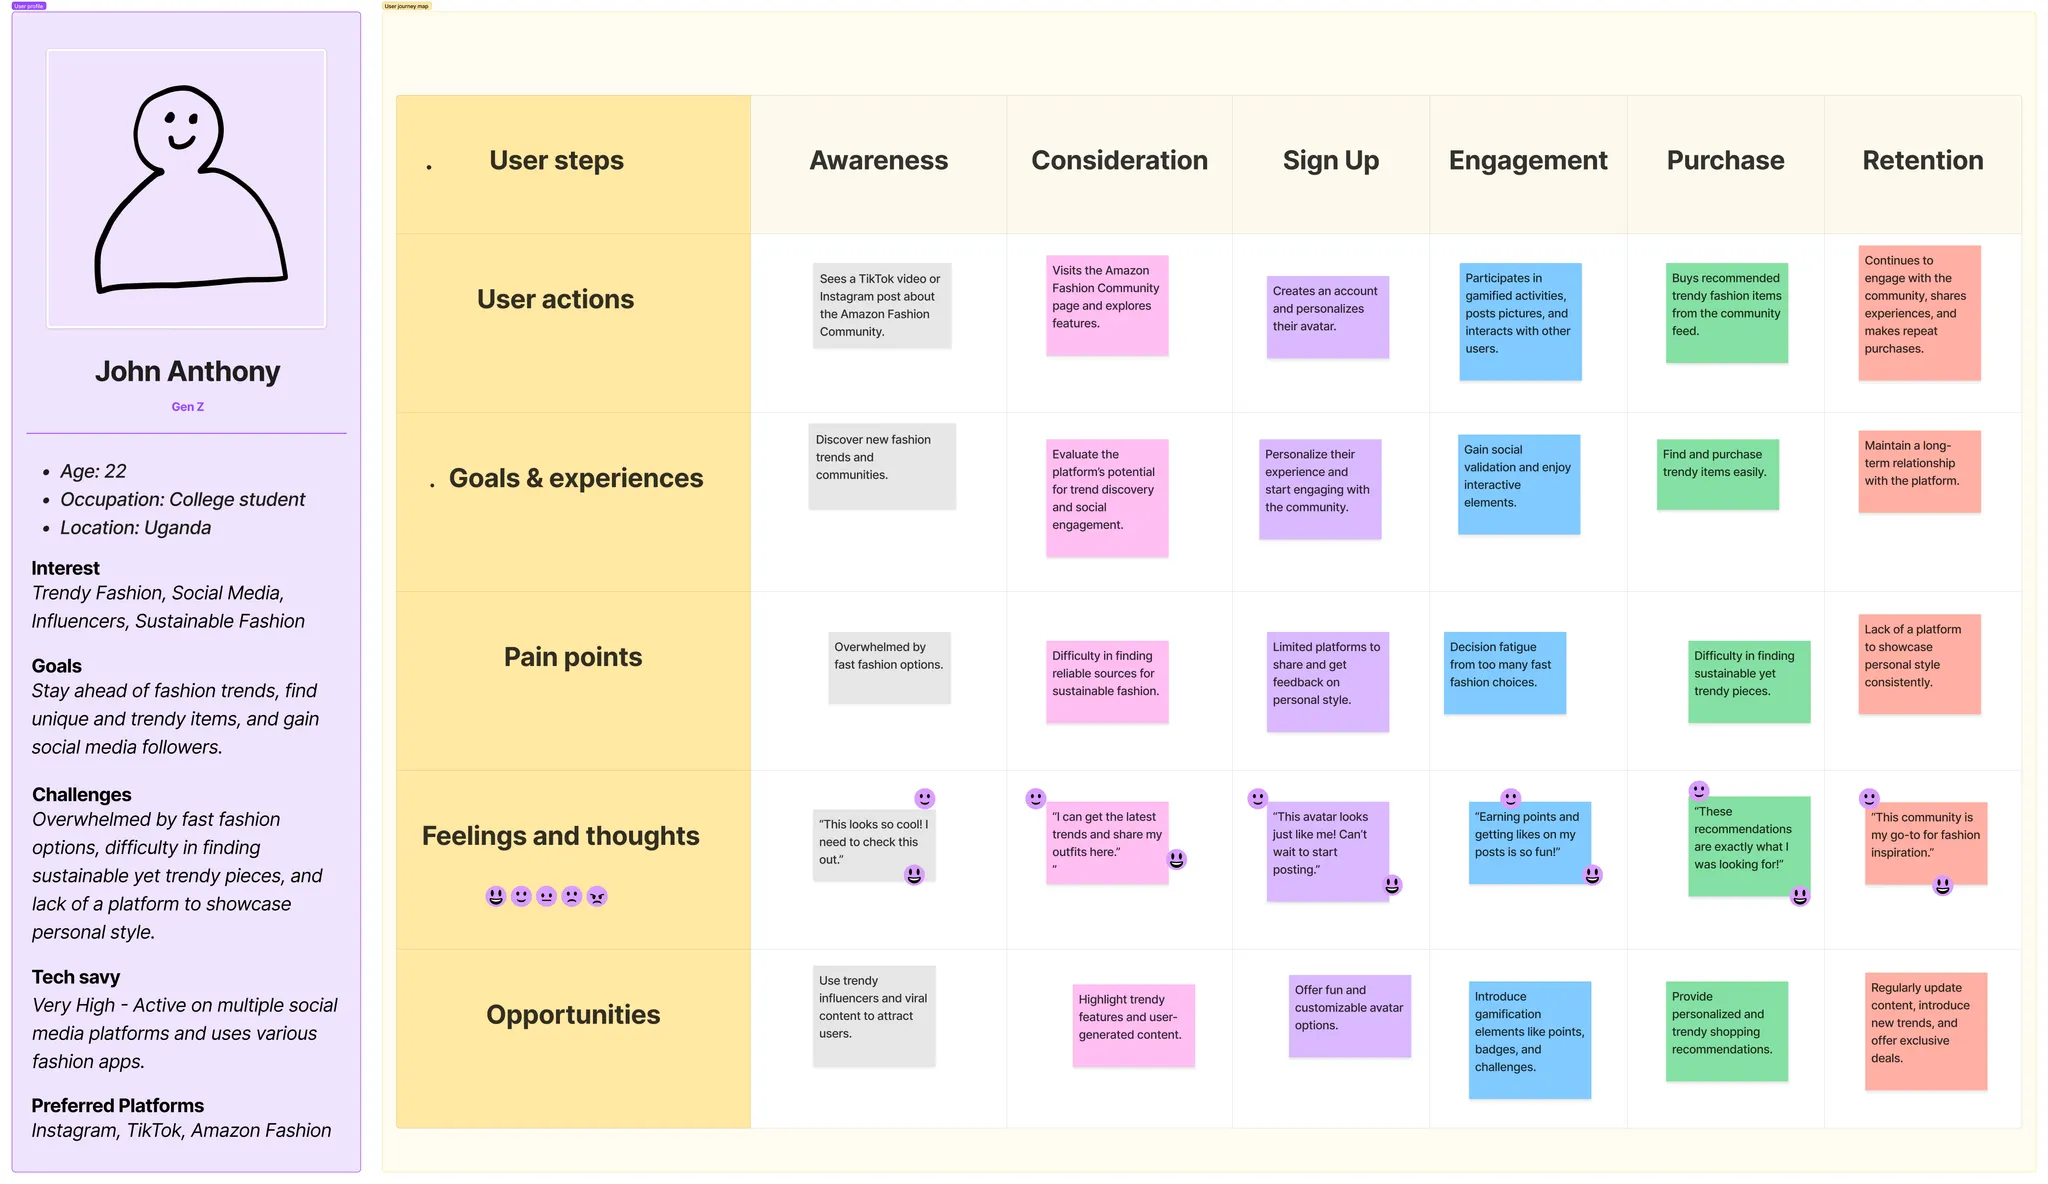
User personas created for the target segments:
.png)
.png)
A combination of qualitative and quantitative research was used to understand user needs in depth.
| Segment | Who They Are | Fashion Preferences |
|---|---|---|
| Gen Zs | Born 1997–2012. Fully digital era natives. | Y2K fashion, gender-fluid styles, DIY fashion. Value uniqueness and self-expression. |
| Millennials | Born 1981–1996. Analog-to-digital transition. | Revamped old styles with modern twist — turn-up jeans, vintage-inspired looks. |
| Category | Method | Data / Insights |
|---|---|---|
| Qualitative | Existing reviews & ratings | Common themes: need for better fit, quality, and trendy styles. |
| Focus groups | Importance of community, personalized recommendations, and social validation. | |
| Quantitative | Interviews | Need for more engaging, interactive experience with styling tips and fashion feeds. |
| Surveys | Significant interest in community features and gamification to enhance shopping. |
Q: "We noticed your last purchase on Amazon Fashion was 2 months ago — any reason?"
Ayush: "Ya, I tried out the Amazon Fashion website and bought a pair of jeans and a blue crop top which did not fit! I was very overwhelmed by the options and the website was very difficult to navigate. It took me about 3 hours to decide only to be disappointed! I'm not good at styling so I didn't know what to match the blue crop top with..."
Anuj: "I really don't like the UI plus the pieces there are really cheap in quality and not up to the fashion trends that I really want to get."
Q: "On a scale of 1–5, how would you rate your experience on our platform?"
Ayush: "2.5. I spent too much time browsing without getting apparel that works for my body size and preferred colors... I simply add things to my Wishlist and never really Checkout, unless there's a huge sale with over 70% discount."
Anuj: "1.5. Not happy at all with the user experience so far."
Q: "How can we improve your shopping experience at Amazon Fashion?"
Ayush: "Maybe I can give you a chance if you build a community of stylists or fashionistas who can advise people who struggle styling on what to wear, how to wear it and where to wear it."
Anuj: "You should improve the UI first, as it is a mess. It should have a really different dedicated corner for fashion trends based on Gen Z and millennial preferences."
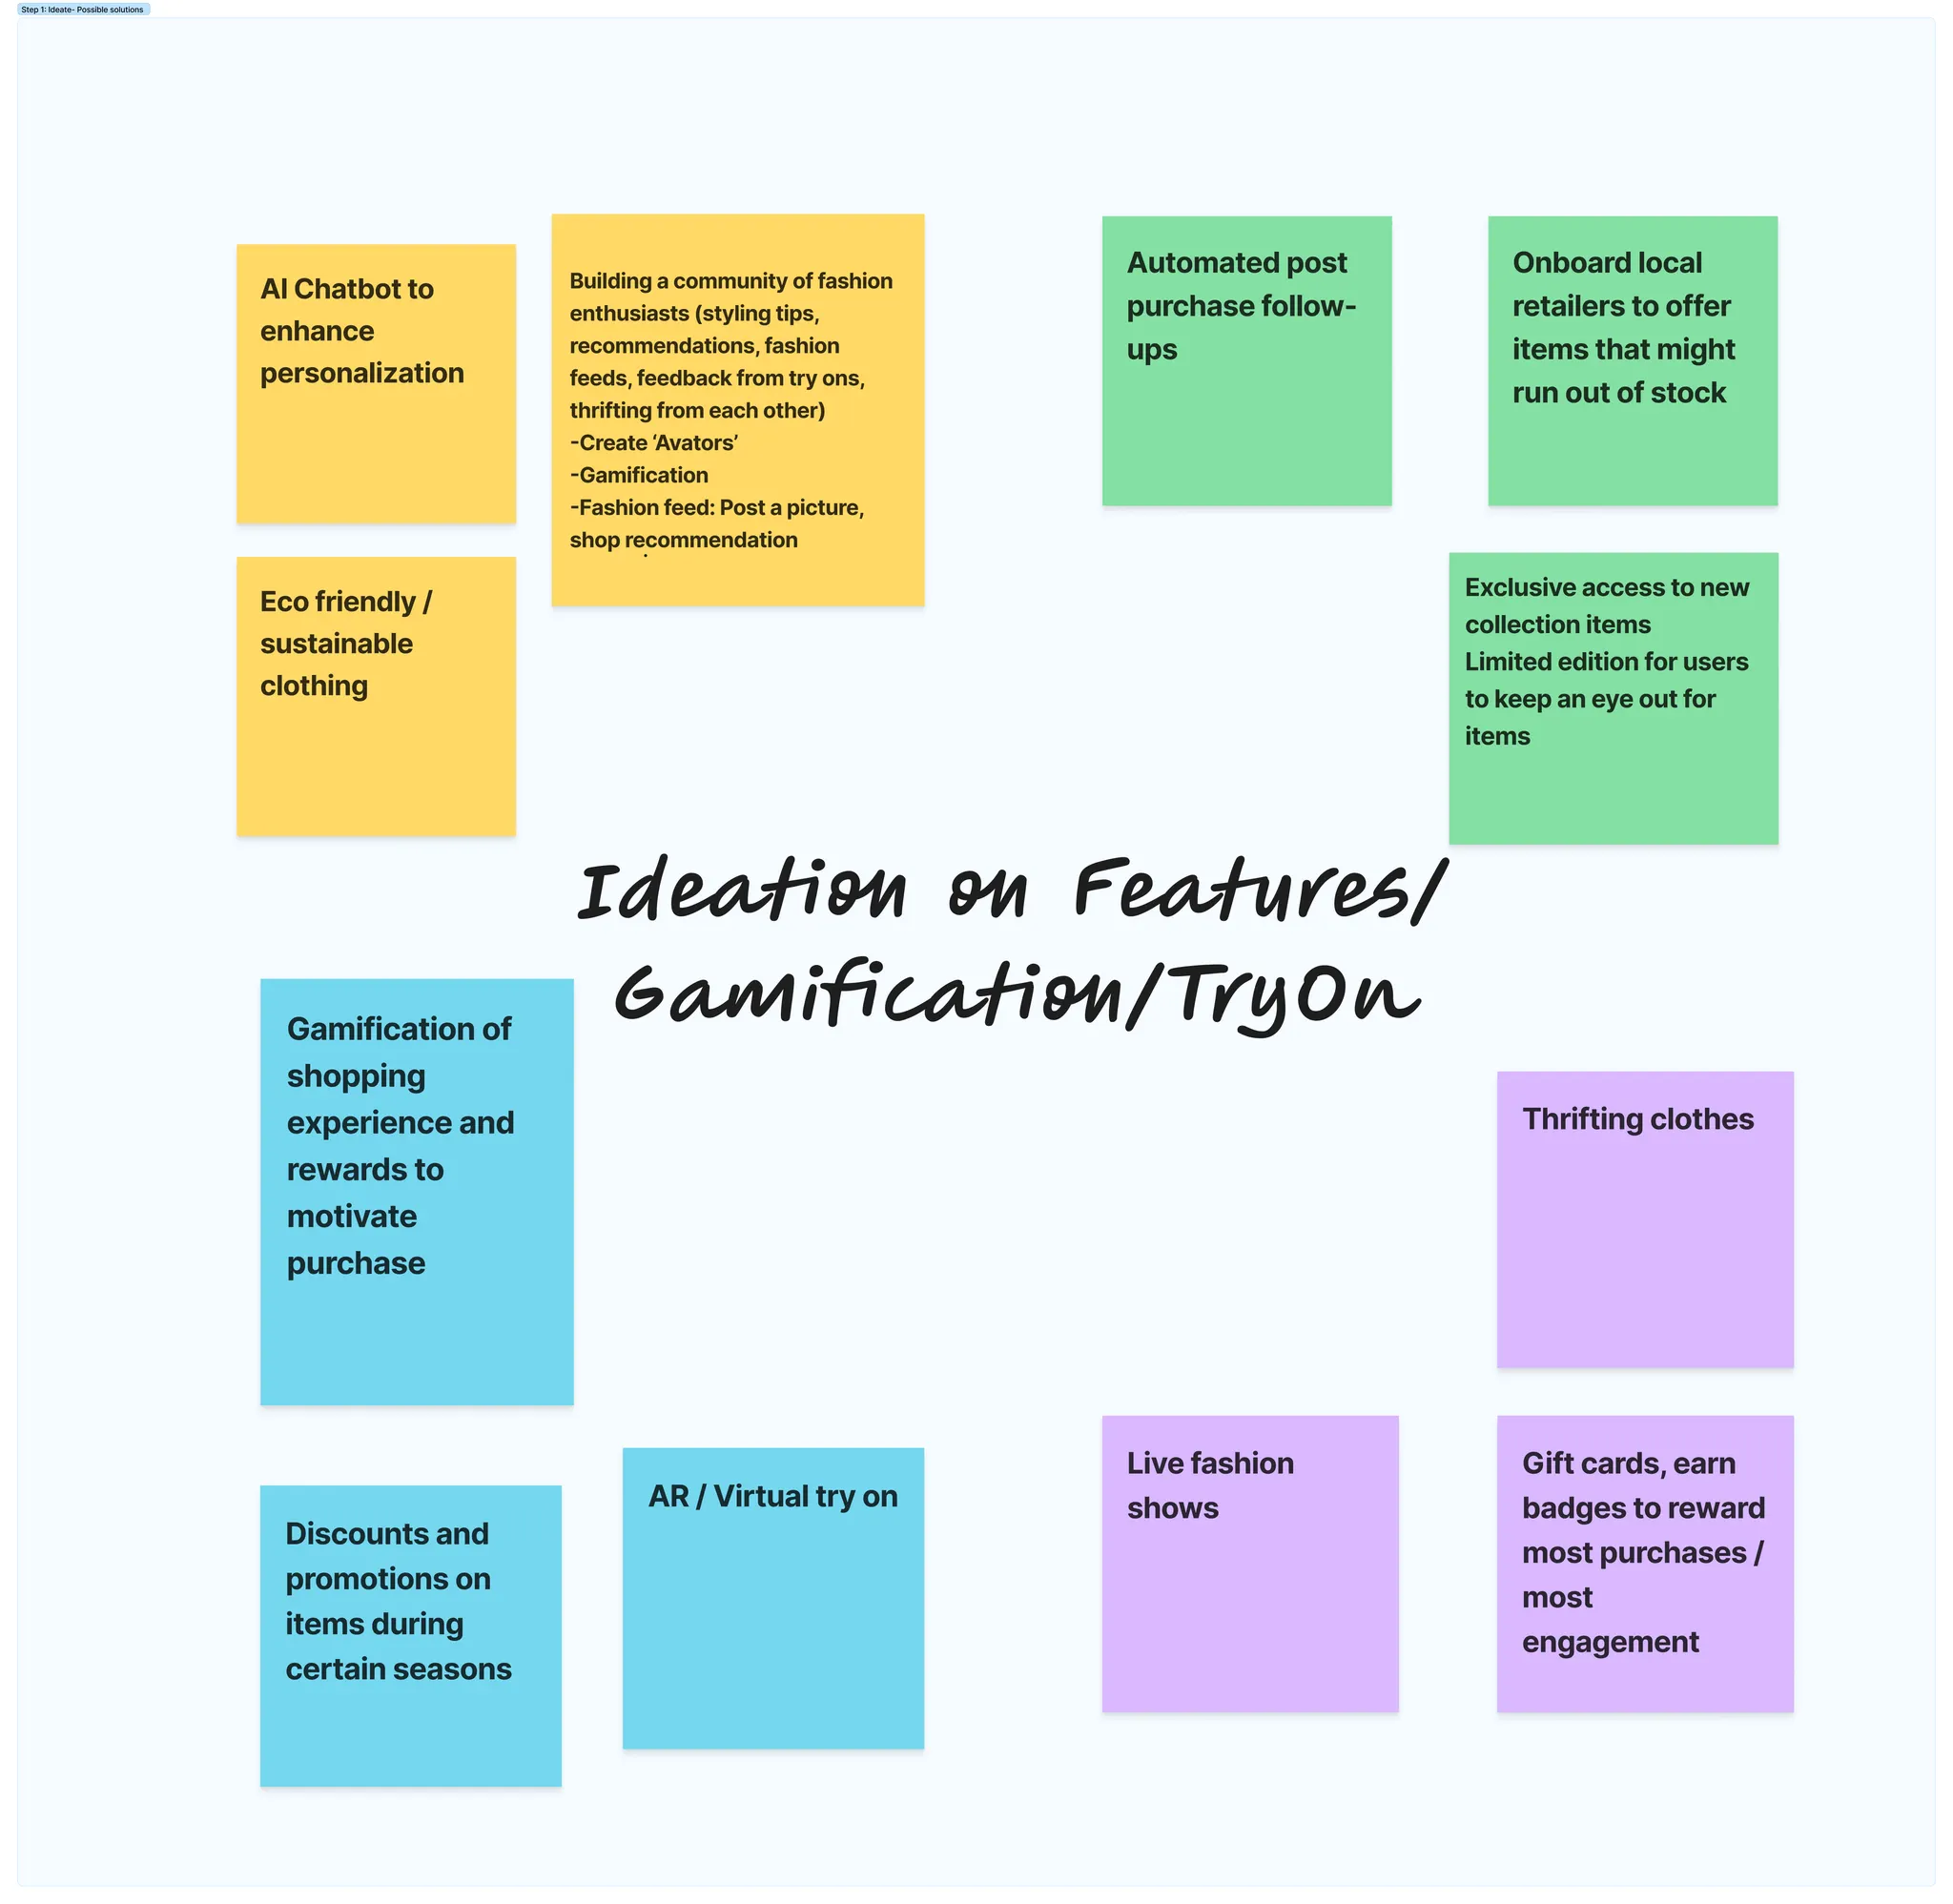
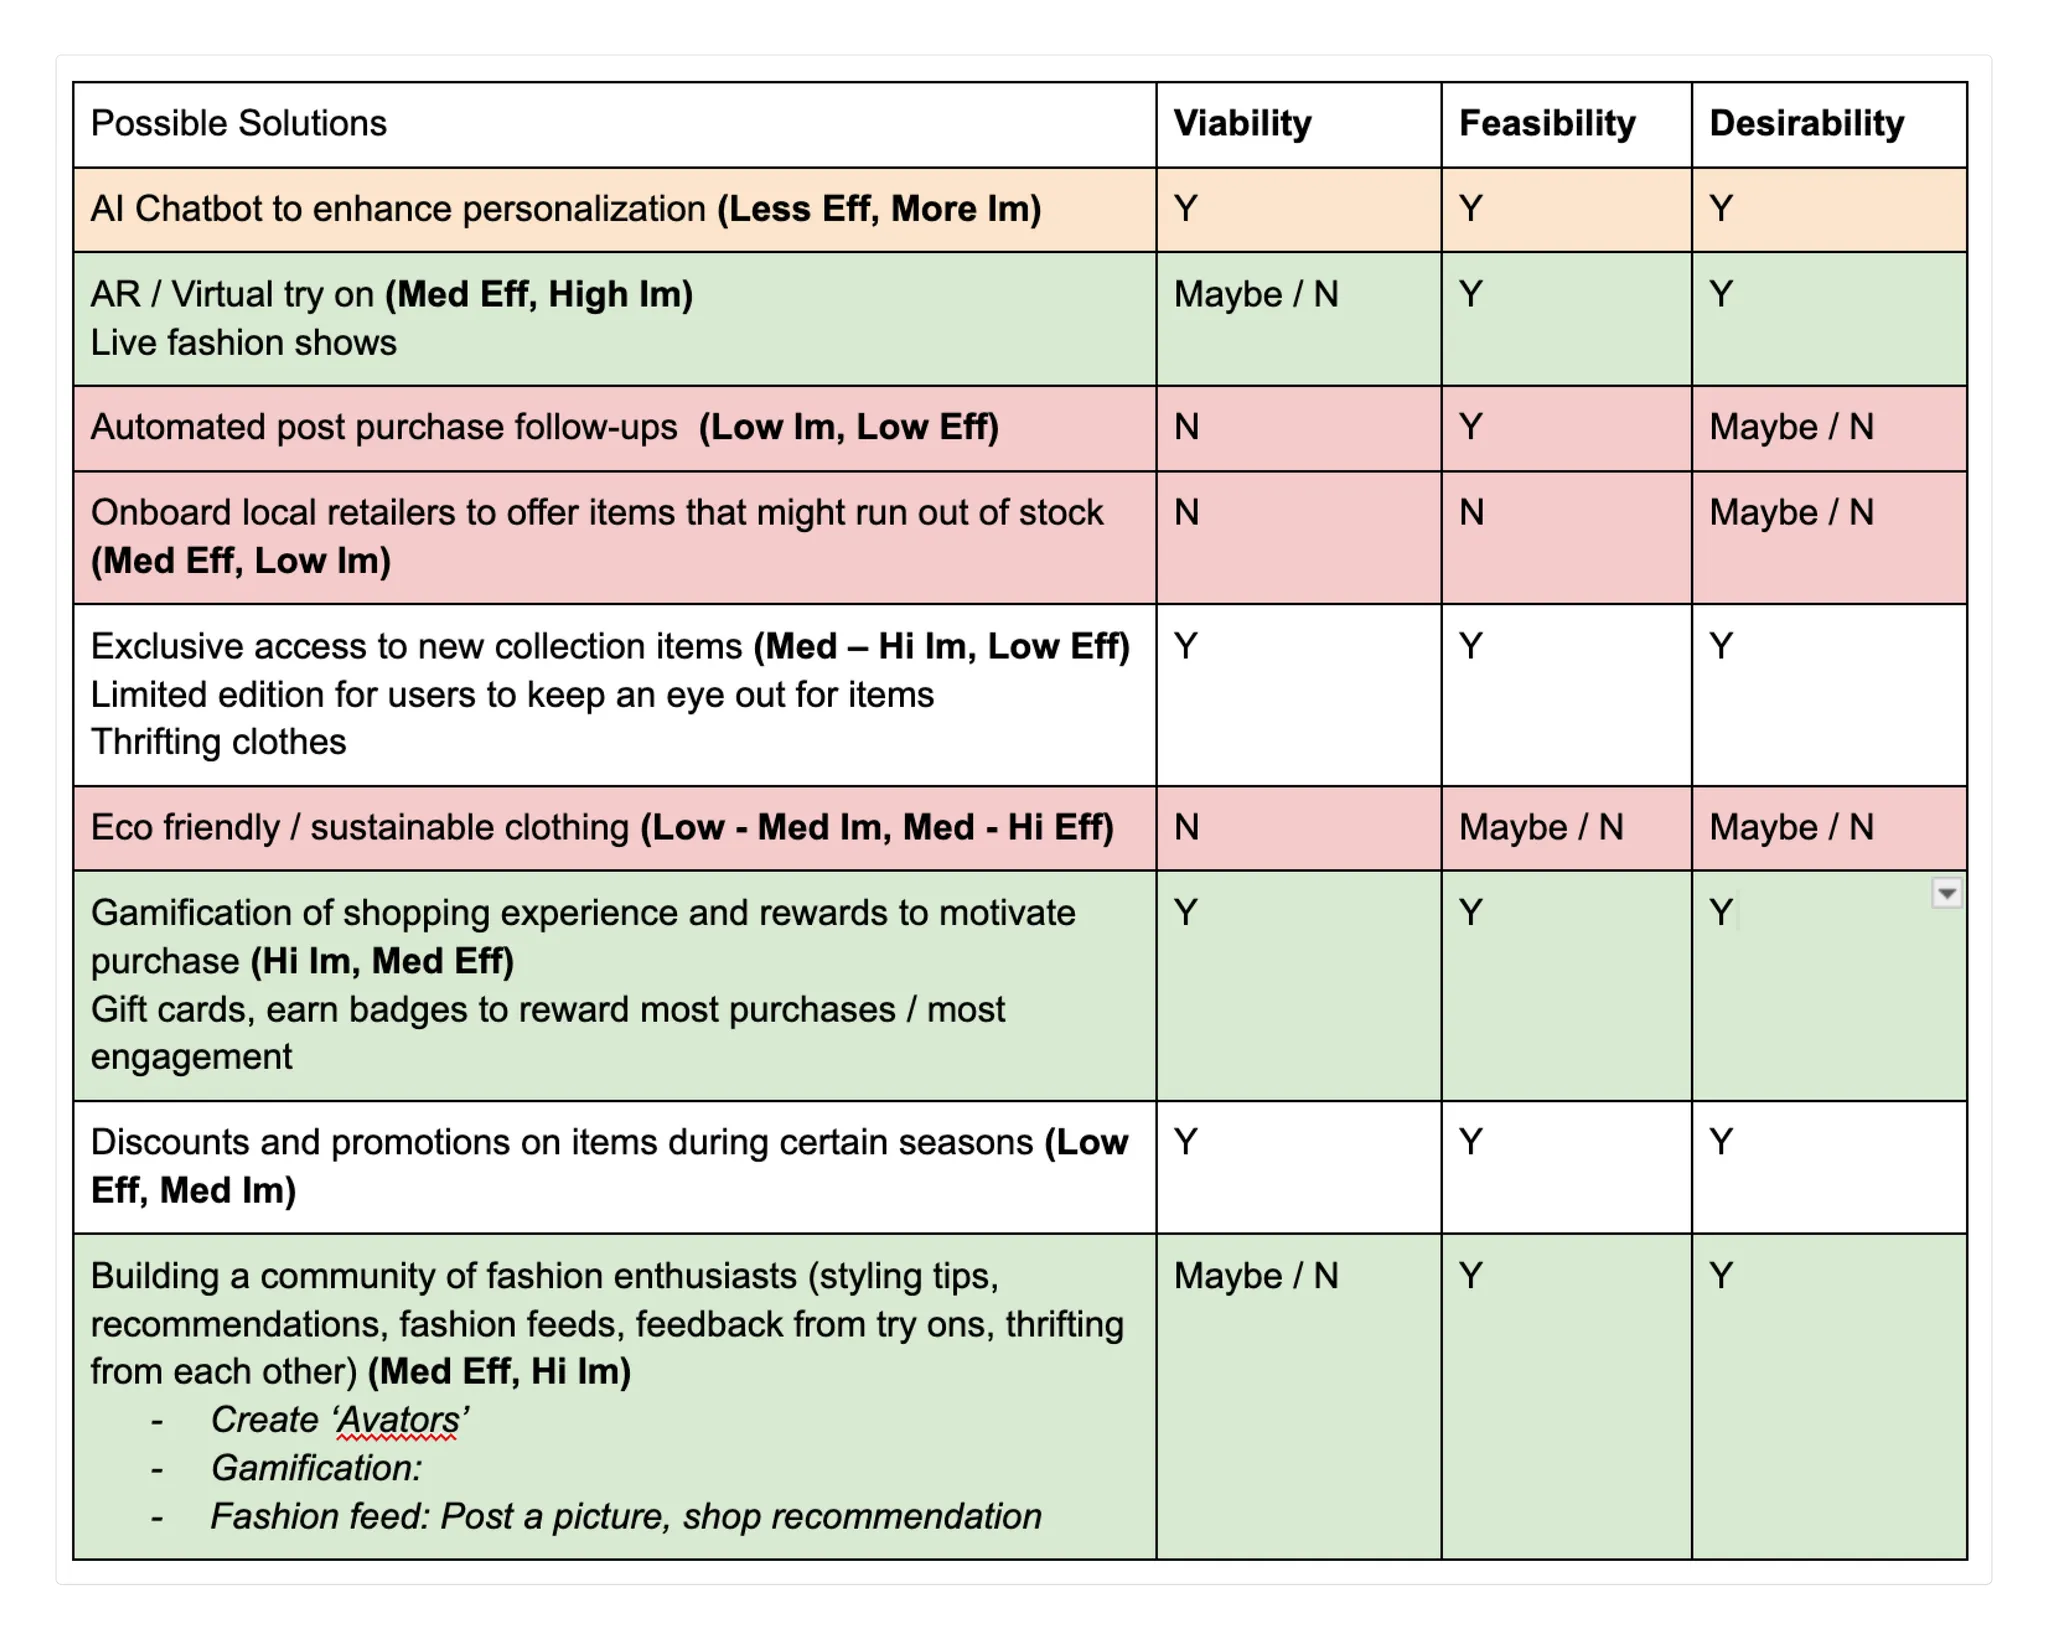
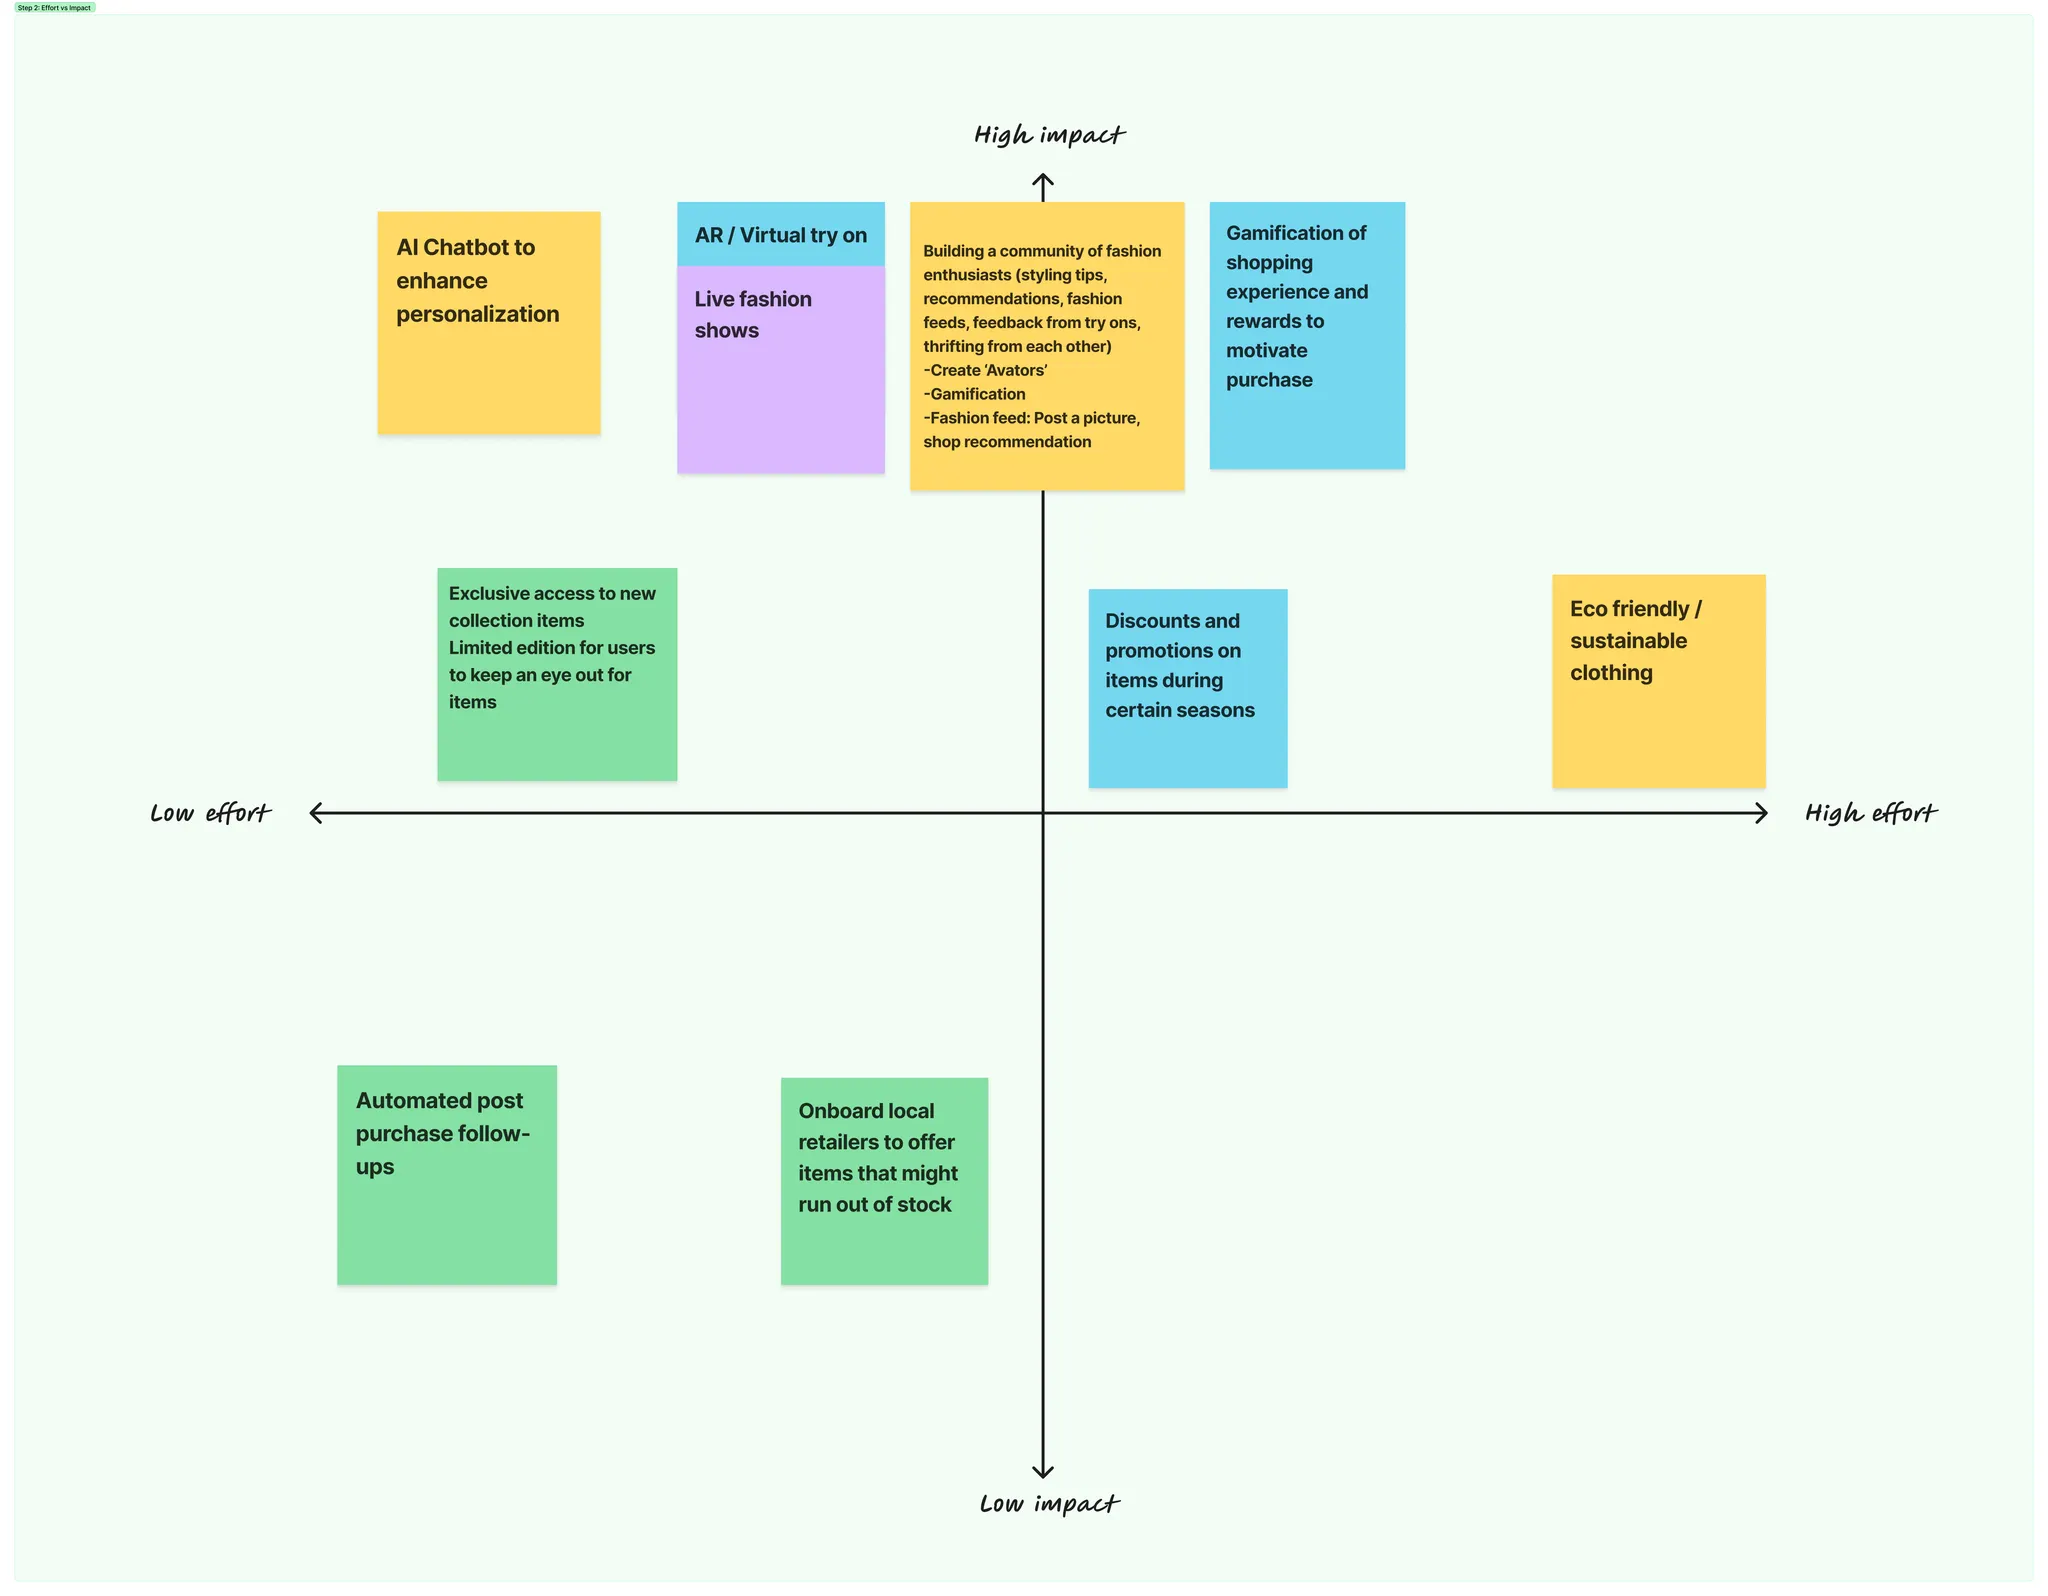
Possible solutions were listed and evaluated on:
User personas and user journeys for Gen Z and Millennials:
Wireframes built for the proposed solution (tablet view):
.png)
.webp)
 View Full Figma — Ideation & Solutions ↗
View Full Figma — Ideation & Solutions ↗
Key metrics and analytics for the proposed solution:
| Aspect | Metric | Description | Tools |
|---|---|---|---|
| Community Engagement | Active users | Track users actively participating in the community. | Google Analytics, Mixpanel |
| User retention rate | Percentage of users who return to community after first visit. | Cohort Analysis, Retention Curves | |
| Engagement rate | Frequency and duration of user interactions within the community. | Session Duration, Heatmaps | |
| Content Interaction | Posts & comments | Count posts, comments, and interactions on fashion feeds. | CMS Analytics, Social Media Analytics |
| Likes, shares, reactions | Track engagement on posts and comments. | Social Media Analytics, In-app Analytics | |
| Gamification | Participants | Count users participating in gamified activities. | In-app Analytics, Gamification Platform |
| Achievement & reward redemption rate | Rate at which users achieve milestones and redeem rewards. | In-app Analytics, Reward System Analytics | |
| Repeat Purchases | Repeat purchase rate | Percentage of users making repeat fashion purchases. | E-commerce Analytics, Purchase History |
| AOV of repeat purchases | Average value of repeat purchases. | E-commerce Analytics | |
| Customer Lifetime Value (CLV) | Total revenue generated by a customer over their lifetime. | E-commerce Analytics | |
| User Feedback | Net Promoter Score (NPS) | User satisfaction and likelihood to recommend. | User Surveys, NPS Tools |
| Technical Performance | Page load time | Time for community pages to load. | Google Analytics, Performance Tools |
These metrics will help gauge the success of the proposed solution and make data-driven decisions to enhance user engagement and drive repeat purchases in Amazon's fashion segment.